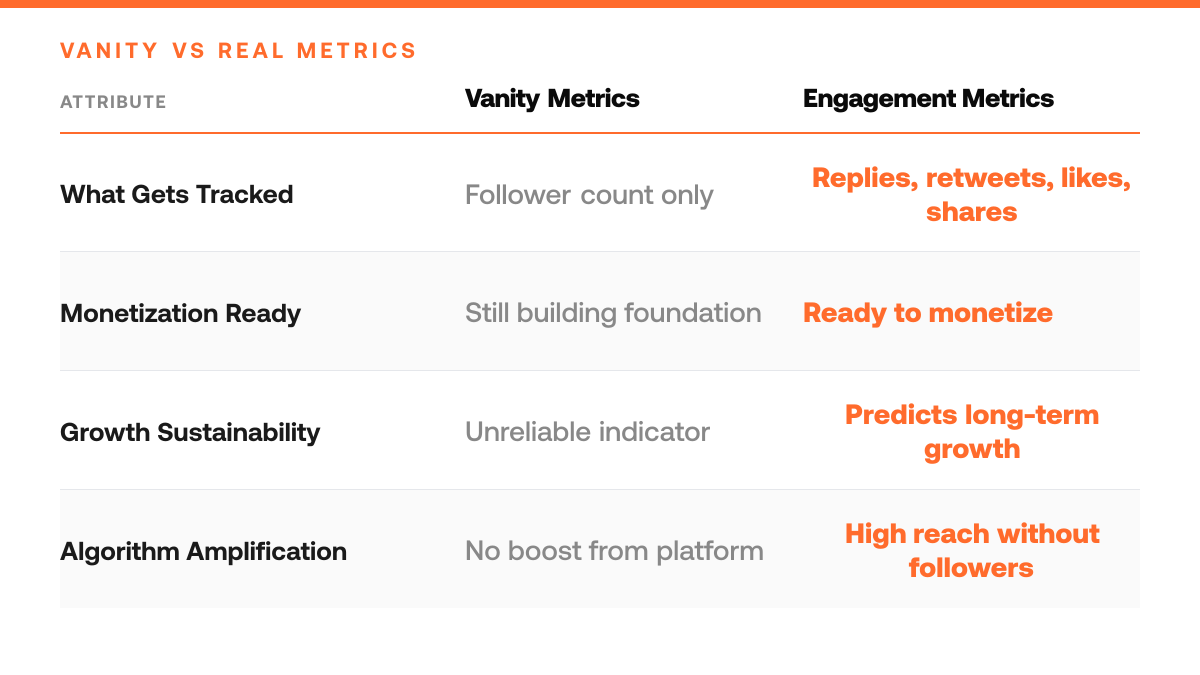
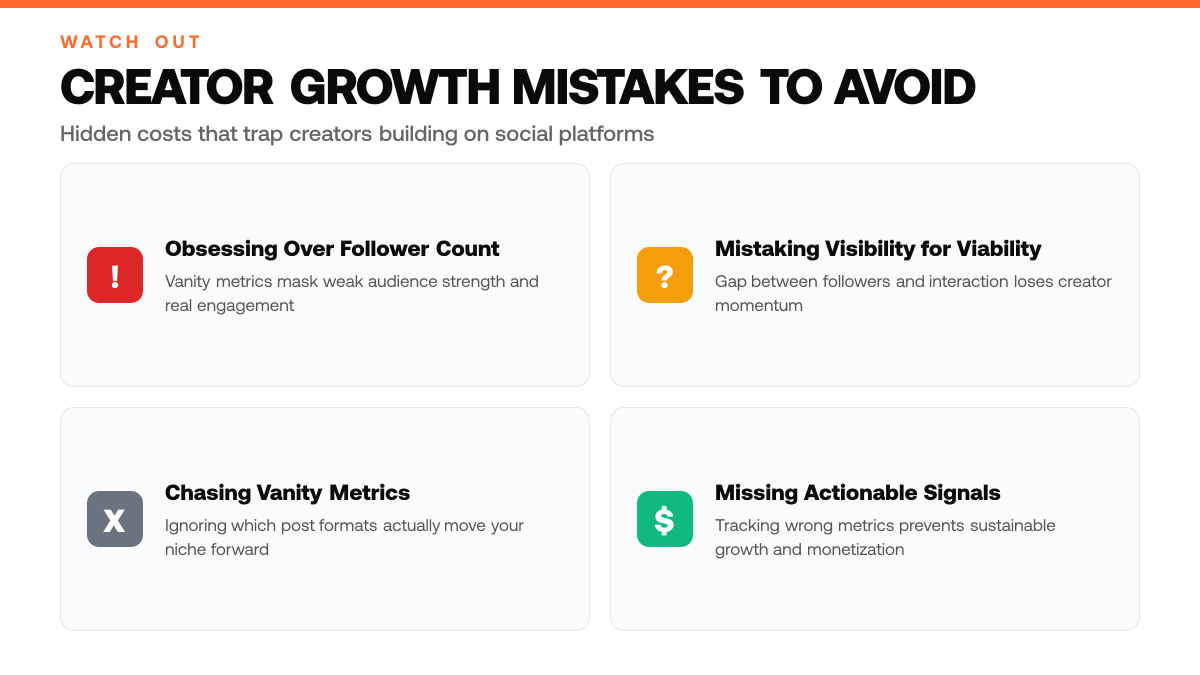
Most creators obsess over follower count, watching that number climb feels like progress. But a creator with ten thousand followers and minimal interaction has a far weaker position than one with two thousand deeply engaged followers. The gap between vanity metrics and real audience strength is where most creators lose momentum, mistaking visibility for viability.
Engagement rate is the metric that separates creators ready to monetize from those still building. It reveals whether your audience actually cares about what you post, not just how many people follow you. Research shows that engagement patterns predict sustainable audience growth and monetization readiness far more reliably than raw follower counts ever could.[1]
This article walks through five metrics that matter on X, the ones that signal real audience quality and growth potential. You'll learn what to track, why each metric matters, and how to use them to make smarter decisions about the content you create. Most creators chase engagement vanity metrics while ignoring which post formats and hooks actually move their niche forward, ClimbX analyzes your highest-performing posts and scans outlier content from accounts ahead of you to surface the exact patterns that drive real growth.
TL;DR
- Engagement rate, reply ratio, retweet-to-like ratio, impression-to-engagement ratio, and audience growth velocity are the five metrics that reveal what content actually resonates with your audience.
- These metrics work together to show not just reach, but meaningful interaction, helping you identify which posts drive real connection versus passive scrolling.
- Most creators track vanity metrics like follower count instead of these actionable signals, missing the data needed to refine strategy and grow sustainably.[2]
Understanding Twitter Engagement Rate
What Is Twitter Engagement Rate?
Twitter engagement rate measures the percentage of impressions that result in meaningful interaction, replies, retweets, likes, and shares. Unlike raw follower counts, which only reflect audience size, engagement rate reveals how actively your audience is responding to your content. This metric cuts through vanity numbers to show whether people actually care about what you're posting. A high engagement rate signals that your tweets resonate with viewers and encourage them to take action, making it a far more reliable indicator of influence than follower count alone.[3]
Why Engagement Rate Matters for Creators
For solo creators and solopreneurs building an audience on X, engagement rate directly impacts your ability to grow and monetize. The platform's algorithm prioritizes content that generates interaction, tweets with higher engagement rates reach more people, amplifying your visibility without requiring additional followers. This creates a compounding effect: better engagement leads to broader reach, which attracts new followers and opens monetization opportunities. Tracking engagement rate helps you understand which content formats, topics, and posting times resonate most with your audience, allowing you to refine your strategy and build sustainable growth.
Engagement Metrics in the Broader Creator Economy
In today's creator economy, engagement metrics have become the currency of influence. Brands, sponsors, and platforms evaluate creators not by follower count but by how actively their audience engages with their content. Reply ratio and retweet-to-like ratio reveal audience sentiment and content resonance, metrics that directly influence algorithmic reach and partnership opportunities. Creators who understand and optimize these ratios gain a competitive edge, attracting collaborations and monetization deals that followers alone cannot secure. For solopreneurs serious about turning their X presence into income, mastering engagement metrics is essential.[3]
Key Numbers for Twitter Engagement Rate: 5 Metrics That Actually Matter (2026)
- 0.03% median engagement rate per post by followers, double the 0.015% benchmark from the prior year.[3]
- Accounts with less than 1k followers averaged 5% engagement, while 10 - 50k follower accounts achieved 3.7%.[4]
- Native video posts perform nearly 4x better at 0.043% engagement versus text-only posts at 0.011%.[3]
- For small accounts, above 1% engagement is the target; 2 - 5% represents excellent performance.[4]
- X engagement climbed to 0.12% by Q1 2026 after hitting 0.015% in 2024, driven by algorithm changes favoring long-form posts and threads.[3]
Step-by-Step Process
1. Track follower growth velocity weekly
Record your follower count every seven days and calculate the net gain from the previous week. Divide weekly follower additions by your current follower count to find your growth rate as a percentage. This ratio, growth velocity, reveals whether your audience is expanding at a healthy pace or stalling. Creators building authentic engagement typically see consistent, incremental gains rather than sudden spikes followed by plateaus. Documenting this metric helps you spot which content types or posting schedules correlate with sustainable follower increases.[4]
2. Calculate engagement-to-follower ratio daily
Sum your likes, replies, and retweets across all posts published in a 24-hour period, then divide by your total follower count. This ratio shows what percentage of your audience is actually interacting with your content. A rising ratio signals that your message resonates more deeply, even if follower count stays flat. Tracking this daily helps you identify which topics, posting times, or content formats drive meaningful interaction rather than passive scrolling.[4]
3. Monitor impression-to-engagement conversion weekly
Pull your total impressions for the week from your analytics dashboard and divide total engagements by that number to get your conversion rate. This metric shows how many people who see your content actually take action. A rising conversion rate means your content is becoming more compelling, while a declining rate signals that your message may need refinement. Compare this across different content pillars, threads, single posts, replies, to identify which formats convert viewers into participants.[4]
4. Assess audience growth authenticity monthly
Compare your follower growth rate against your engagement growth rate over a 30-day window. If followers are climbing but engagement remains flat or drops, growth may be artificial, attracting inactive accounts rather than genuine readers. Conversely, if engagement grows faster than followers, your content is resonating deeply with a smaller, more invested audience. This monthly audit prevents you from optimizing for vanity metrics and keeps your strategy aligned with sustainable, monetizable growth.[4]
5. Document patterns in a simple spreadsheet
Create columns for the date, follower count, weekly growth rate, engagement ratio, and impression conversion. Update it every Sunday to capture the week's performance. Over several weeks, patterns emerge: which days generate more engagement, which topics attract followers, which content types convert viewers into participants. This systematic record transforms raw numbers into actionable insights, letting you optimize future content with confidence rather than guesswork. Review the spreadsheet monthly to refine your content strategy based on real performance data.[4]
How This Works in Practice
Example 1: The Content Creator Discovering Which Posts Monetize
Picture a solo creator who has built a following of several thousand on X but struggles to convert that audience into sponsorship opportunities. She posts regularly, a mix of threads, quick takes, and industry commentary, but doesn't track which content types generate the most meaningful interaction. When she begins analyzing engagement rate by post type, she notices her long-form threads on emerging trends attract replies and retweets from accounts with strong follower counts and high engagement themselves. Her quick takes, though popular, draw mostly passive likes from smaller accounts. By shifting her content mix toward the thread format and monitoring which topics spark conversation among high-engagement followers, she becomes attractive to brand partners seeking authentic reach. Within weeks, sponsorship inquiries arrive from companies specifically interested in her engaged, monetization-ready audience rather than her raw follower count alone.
Vanity Metrics vs. Actionable Engagement Signals
| What Creators Track | What Actually Matters |
|---|---|
| Follower count climbing | Engagement rate revealing audience care |
| Raw visibility numbers | Reply ratio and retweet-to-like patterns |
| Passive audience size | Active interaction and meaningful connection |
| Impressions alone | Impression-to-engagement conversion |
Example 2: Two Creators, Identical Followers, Vastly Different Earning Potential
Consider two creators who each have built audiences of similar size on X. Creator A posts daily, accumulating followers steadily, but engagement metrics reveal that most interactions come from bot accounts and inactive followers. Creator B posts less frequently but focuses on sparking genuine conversation, asking questions, responding to replies, and building community around a specific niche. When both approach potential sponsors, Creator A's follower count looks impressive on paper, but deeper engagement analysis shows shallow interaction and low likelihood of audience action. Creator B's smaller-seeming metrics reveal a far more engaged, responsive audience. Sponsors recognize this difference immediately: they choose Creator B because engagement rate analysis proves her audience is more likely to click links, make purchases, or take action. The gap in earning potential widens not because of follower count but because one creator understood which metrics reveal true monetization readiness.
Why Engagement Reveals True Opportunity
Both examples illustrate the same principle: raw follower counts mask the real story. Engagement rate analysis cuts through the noise, showing which content types resonate with audiences that actually convert, and which creators have built genuine influence versus inflated vanity metrics. For solopreneurs building toward monetization, this distinction is everything.
Weekly Twitter Engagement Tracking Checklist
- Record your weekly impression count and compare it to the previous week to identify growth patterns.
- Log your engagement rate (replies, retweets, likes combined) for each top-performing tweet.
- Track follower growth week-over-week to spot which content types drive audience expansion.
- Document click-through rates on links shared in your tweets to measure audience action.
- Review reply sentiment and quality to assess whether your audience engagement is attracting the right followers.
Common Mistakes to Avoid
Mistake: Obsessing over like count while ignoring reply ratio
Likes feel like validation, but they're passive. Sponsors and platforms prioritize genuine interaction, replies signal that your audience is invested enough to respond. A tweet with 500 likes but 3 replies shows surface-level appeal, not community. Track your reply ratio alongside likes to identify which topics actually spark conversation. High-reply content is what algorithms amplify and what brands pay for.[1]
How Engagement Metrics Drive Creator Growth
| Metric Type | What It Reveals | Impact on Growth |
|---|---|---|
| Engagement rate | Percentage of impressions resulting in interaction | Algorithmic prioritization and amplified reach |
| Reply and retweet ratios | Audience sentiment and content resonance | Competitive edge for partnerships and deals |
| Audience growth velocity | Sustainable growth patterns | Monetization readiness and viability |
| Impression-to-engagement ratio | Passive scrolling vs. real connection | Strategic refinement and content optimization |
Mistake: Treating impression count as proof of engagement
Impressions (how many times your tweet was seen) and engagement rate are completely different metrics. A tweet with 10,000 impressions but only 50 interactions has a 0.5% engagement rate, which is weak. Impressions alone don't mean your content resonated. Always calculate engagement rate by dividing total interactions by impressions to understand true performance. This prevents you from overestimating weak content and wasting time on what doesn't actually connect.[1]
Mistake: Ignoring reply sentiment and quality over reply volume
Not all replies are equal. A tweet with 20 replies praising your insight is vastly more valuable than 20 replies of spam or argument. Skim your replies to assess whether engagement is positive, constructive, or promotional. Quality replies from your target audience (potential customers, collaborators, peers) matter more than raw numbers. This distinction guides which content to double down on for monetization.
Frequently Asked Questions
Why should I track these five metrics instead of just follower count?
Follower count alone masks what's actually working. These five metrics, reply rate, retweet rate, like rate, impression share, and click-through rate, reveal which content resonates, how your audience engages, and where growth opportunities live. Understanding these metrics is the foundation for using AI-driven tools to optimize your content strategy. Without this data, you're guessing at what works; with it, you're making decisions based on real audience behavior.
How often should I review my Twitter engagement metrics?
Weekly reviews work best for most creators. A weekly cadence gives you enough data to spot trends without becoming overwhelming. Tracking these metrics consistently removes the manual work of audits and lets you catch shifts in audience behavior early, when you can still adjust your content strategy. Monthly reviews miss short-term patterns; daily reviews create noise.
What's the difference between engagement rate and impression share?
Engagement rate measures how many people who see your post interact with it (replies, retweets, likes combined). Impression share shows what percentage of your followers actually saw the post in their feed. A high engagement rate on low impressions means your content resonates but isn't reaching enough people. A high impression share with low engagement means visibility isn't the problem, your content hook or value proposition needs work.
Start your 7-day trial
Grow on X without sounding like everyone else. The right tool learns from your top posts and the leading voices in your niche, then drafts content in your voice. You edit, approve, and ship.
Start free trialSources
Read next
- X Posts in Google Search Console: The New SEO Opportunity - Google Search Console can now track the queries, impressions, clicks, CTR, and position of your X posts. Here is how creators can turn social posts into a measurable SEO and AI-search research loop.
- X Algorithm Labels Explained: How Visibility Filtering Works - X can label accounts and posts before deciding where they may appear. See the real DoNotAmplify, SpamHighRecall, abuse, NSFW, and post-level labels in X’s open-source algorithm.