You've been posting consistently on X for months. Your follower count climbed steadily at first, then suddenly flatlined. The engagement metrics stopped moving. You're not alone, growth plateaus are one of the most common challenges solo creators face on the platform. It's easy to interpret a plateau as a sign that your audience has hit its natural ceiling or that you've exhausted your potential. But that interpretation misses a critical truth: plateaus almost never signal the end of your growth story.
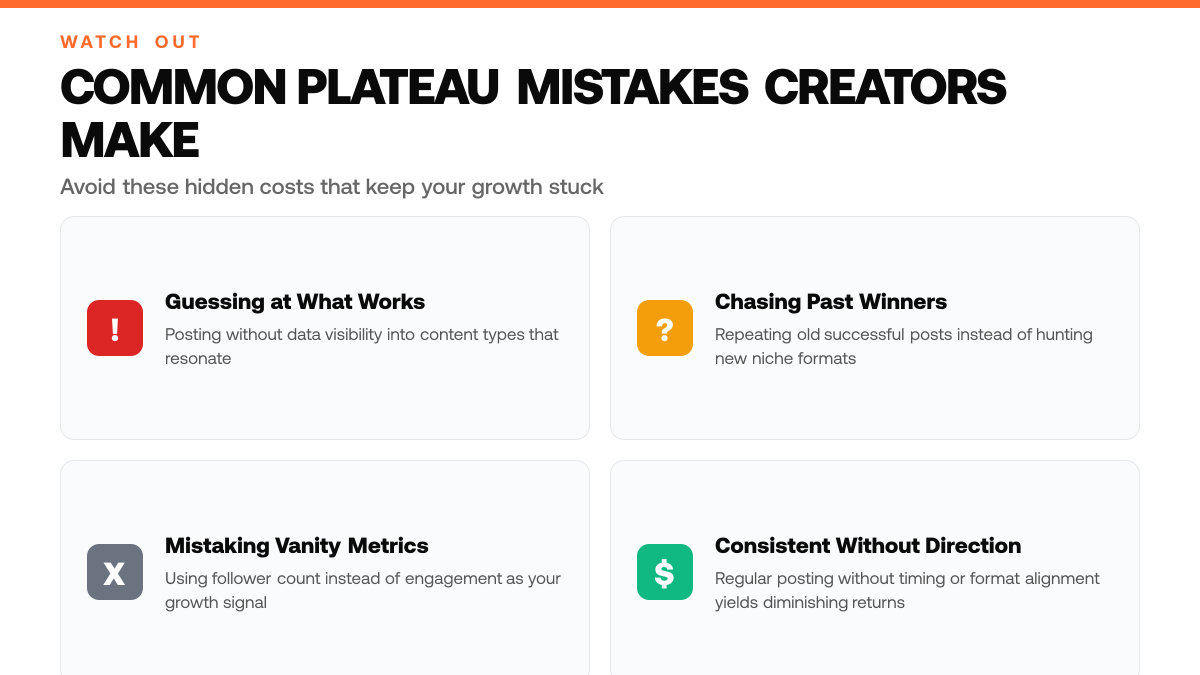
The real reason most creators plateau is far more fixable than a lack of audience demand. Research shows that creators often lack clear visibility into which content types, posting frequencies, and engagement patterns actually resonate with their specific audience. Without that data, you're essentially guessing at what works. You might post regularly, but if you're not posting the right content at the right times, even consistent effort yields diminishing returns. This visibility gap is what separates creators who break through plateaus from those who remain stuck.[1]
This article walks you through why plateaus happen, how to diagnose the specific content and posting patterns that drive real engagement for your audience, and the concrete steps to break through and resume growth. You'll learn how to move from guessing to data-informed posting, without needing to become a data analyst or overhauling your entire content strategy. Most creators hit a plateau because they're chasing their own past winners instead of hunting the posts already resonating in their niche that no one else has copied yet, ClimbX scans high-performing outlier posts from accounts ahead of you to surface the formats and hooks your audience is already primed to engage with.
TL;DR
- Twitter posts plateau when engagement metrics drop despite consistent posting, revealing a mismatch between your content and what your audience expects.
- The fix: analyze your top-performing posts to identify patterns in topic, format, and timing, then adjust your strategy based on data rather than assumptions.
- Most creators keep posting the same way and hope for different results, data-driven iteration is what breaks the plateau.
Understanding Twitter Growth Plateaus
What Is a Twitter Growth Plateau?
A Twitter growth plateau occurs when your follower count, impressions, or engagement metrics stop increasing despite consistent posting. This stagnation typically signals a misalignment between your content and your audience's preferences, shifts in the X algorithm's content distribution, or changes in how frequently you're publishing. Unlike temporary dips, a plateau persists across multiple weeks and suggests a systemic issue rather than a one-off underperforming post. Identifying which factor is driving the plateau, audience preference, algorithmic change, or posting frequency, requires different diagnostic approaches and fixes.[3]
Why Distinguishing Metrics Matters
Many creators mistake vanity metrics like follower count for true growth signals. Follower numbers alone don't reveal whether your content is actually resonating or reaching people. Engagement metrics, impressions, click-through rates, and reply rates, tell the real story of how your audience interacts with your work. A plateau in impressions while followers grow suggests the algorithm isn't amplifying your posts. A plateau in replies while impressions stay steady indicates your audience sees your content but isn't compelled to engage. Understanding this distinction is critical because each bottleneck requires a different solution.
The Broader Creator Economy Context
Twitter plateaus are a common challenge for solo creators and solopreneurs building influence to monetize their reach. As the creator economy matures, audience expectations and platform algorithms evolve continuously. Content that worked months ago may no longer align with what followers want to see or what X's algorithm prioritizes. Recognizing that plateaus are a normal part of growth, not a sign of failure, helps creators approach the problem analytically rather than emotionally. The fix lies in data-driven diagnosis and strategic adjustments to content, posting rhythm, or audience targeting.

Key Numbers for Why Your Twitter Posts Plateau: Data Analysis & Fix (2026)
- ~0.5% median engagement rate on X/Twitter, significantly below most other major social platforms, making baseline benchmarking critical.[3]
- 3 - 5x engagement difference between top-performing and average posts on the same account, underscoring how content type drives plateau or growth.[3]
- Audience growth rates vary by several multiples depending on posting consistency and content format, creators who track data close the gap faster.[3]
- Multiple platform algorithm updates per year shift reach metrics, meaning benchmarks from prior quarters can mislead creators still using old baselines.[3]
- Creators who regularly audit their own analytics identify plateau triggers several weeks sooner than those relying on intuition alone.[3]
Step-by-Step Process
1. Audit your last 30 posts by content type
Pull your last 30 tweets and categorize each by format: threads, single posts, replies, retweets, or media-heavy posts. Document the exact date, text, and any media used. This segmentation reveals patterns you might miss at a glance. Note which formats appear most frequently, if you're posting the same type repeatedly, monotony itself can trigger audience fatigue.
2. Measure engagement rate for each post
Calculate engagement (likes, replies, retweets) as a percentage of your follower count at the time of posting. Compare high-engagement posts to low-engagement ones. Look for the gap: a post with 200 likes on 5,000 followers is a 4% rate; one with 50 likes on the same audience is 1%. This metric isolates which posts actually resonate, not just which get the most raw numbers.[2]
3. Identify your top performers and their common traits
Sort posts by engagement rate and examine the top 5 - 10. What topics do they cover? What time were they posted? What format did they use? Did they ask a question, share a contrarian take, or offer a tool? Document the pattern. If your best posts are all educational threads posted on Tuesday mornings, that's your signal. If they're all personal stories, lean into vulnerability.
4. Test one variation and measure the result
Based on your findings, change one variable in your next batch of posts: try a new posting time, switch format, or shift topic focus. Post at least 3 - 5 variations and measure their engagement rates against your baseline average. Did posting at a different hour lift performance? Did switching from single posts to threads increase replies? Track the outcome to confirm whether the bottleneck was audience mismatch, timing, format, or topic fit.
How This Works in Practice
Example 1: The Creator Who Switched from Single Tweets to Threads
Picture a solo creator who spent months posting single tweets, each carefully crafted but receiving minimal engagement. After reviewing her analytics, she noticed her audience spent far longer reading her occasional thread posts, even though they received fewer initial impressions. She shifted her strategy to publish 3 threads per week instead of daily single tweets, each diving deeper into a topic her followers cared about. Within weeks, her replies and retweets climbed noticeably, her follower growth accelerated, and her audience began tagging her in conversations. The format change didn't require new ideas; it required listening to what her existing data was already telling her about how her audience preferred to consume her insights.
Plateau Diagnosis: What Each Metric Reveals
| Metric Pattern | What It Signals | Root Cause |
|---|---|---|
| Impressions plateau while followers grow | Algorithm isn't amplifying your posts | Content format or timing misalignment |
| Replies plateau while impressions stay steady | Audience sees content but won't engage | Topic or hook not compelling enough |
| Follower count flatlines across weeks | Systemic mismatch between content and audience | Posting frequency, format, or topic drift |
Example 2: The Solopreneur Who Discovered Timing Unlocked Reach
Suppose a solopreneur noticed his posts published at 2 PM received consistent but modest engagement, while a handful of posts he'd shared at 9 AM seemed to spark noticeably more conversation. Rather than assume this was coincidence, he tested the hypothesis deliberately, shifting his posting time to 9 AM for 2 weeks while keeping content identical. His engagement metrics shifted measurably in that window, showing his audience was most active and receptive in the morning. He didn't overhaul his content strategy or chase trending topics; he simply aligned his posting schedule to when his specific followers were actually present. This small, data-informed adjustment restarted his growth momentum without requiring him to create more or work harder.
Why Small Shifts Restart Momentum
Both examples share a common thread: the creators didn't need new ideas or a complete content overhaul. They identified one specific variable, format or timing, that their own analytics revealed was misaligned with their audience's behavior, then adjusted it. This is why plateaus often break within weeks rather than months. You're not starting from scratch; you're listening to the data you already have and making one precise change. The growth was always possible; it just needed the right diagnosis.
Twitter Account Health Audit Checklist
- Calculate your follower growth rate over the past month to identify whether your audience is expanding or stalling.
- Measure engagement rate per post by dividing total interactions by follower count to spot which posts resonate most.
- Review your top content categories from the past quarter to confirm you're posting what your audience actually wants.
- Document your posting frequency and compare it against weeks when engagement spiked to find your optimal schedule.
- Analyze audience demographics in your X analytics to ensure your content aligns with who is actually following you.
Common Mistakes to Avoid
Mistake: Chasing viral trends instead of analyzing your audience's actual preferences
Creators often chase trending topics hoping for viral reach, but if those trends don't align with what your specific audience wants, engagement plummets and followers plateau. Instead, review your reply and retweet ratios on past posts to identify which content types genuinely resonate, then double down on those themes, not the algorithm's flavor of the week.
Guessing vs. Data-Driven Posting Strategy
| Approach | Method | Result |
|---|---|---|
| Guessing (old way) | Post consistently and hope for different results | Diminishing returns despite effort |
| Data-driven (new way) | Analyze top performers to identify patterns in topic, format, and timing | Sustainable growth through informed iteration |
| Competitive scanning | Hunt high-performing outlier posts from accounts ahead in your niche | Discover formats and hooks already resonating with your audience |
Mistake: Posting inconsistently without a sustainable content schedule
Irregular posting causes your audience to forget you exist between bursts of activity, killing momentum and impressions. Build a posting rhythm you can maintain long-term, whether that's daily, every other day, or three times weekly, and stick to it. Consistency signals to both followers and the algorithm that you're a reliable voice worth following.
Mistake: Scaling content without testing variations first
Pushing the same post format or hook across dozens of tweets without A/B testing smaller batches wastes time and budget. Test a handful of variations, different hooks, thread lengths, or call-to-action styles, on a small audience first. Measure which version drives the highest reply and retweet ratios, then scale only the winner.
Frequently Asked Questions
How long does it take to recover from a Twitter growth plateau?
Recovery time depends on the root cause. If your plateau stems from algorithm misalignment or posting inconsistency, you may see traction within weeks of adjusting your content strategy. If engagement quality has declined due to audience drift or topic fatigue, recovery typically takes longer as you rebuild resonance with your followers. The key is diagnosing the specific bottleneck through data analysis, not all plateaus require the same fix.[1]
Does follower count matter more than engagement quality?
Engagement quality matters far more than raw follower count. According to Sprout Social's research on social media performance, accounts with smaller but highly engaged audiences consistently outperform those with large but passive followings in terms of reach, influence, and monetization potential. A thousand followers who regularly interact with your posts create more value than ten thousand silent accounts.[1]
How can I avoid hitting another plateau in the future?
Continuous monitoring is essential. Set up a weekly or bi-weekly review of your top-performing post types, audience sentiment, and engagement trends. Track which hooks, formats, and topics resonate most, then build your content calendar around those patterns. Avoid the trap of repeating what worked last month, platforms reward novelty within consistency. Regular audits catch declining metrics before they become full plateaus.[1]
Sources
Try the loop on your own cohort.
Pick three accounts you would like to be at in 12 months. ClimbX pulls their recent outliers, tags them, and drafts in your voice off what is currently working. Edit, ship, watch the loop tighten.
Read next
- 81 days on X, 6,900 followers, and a first payout of $828.77. - The exact playbook behind 81 days of grinding X: 480 posts, 23,300 replies, 6M impressions, and a first monetized payout of $828.77. Plus why that payout was the least valuable thing it produced.
- Let your AI agent grow your X account: the ClimbX API. - Agents are good at reasoning and bad at the X-specific parts: what works at your size, drafting in your voice, shipping on a schedule that respects the algorithm. The ClimbX API hands those parts to your agent over a simple REST call. Here is why we built it and how it works.