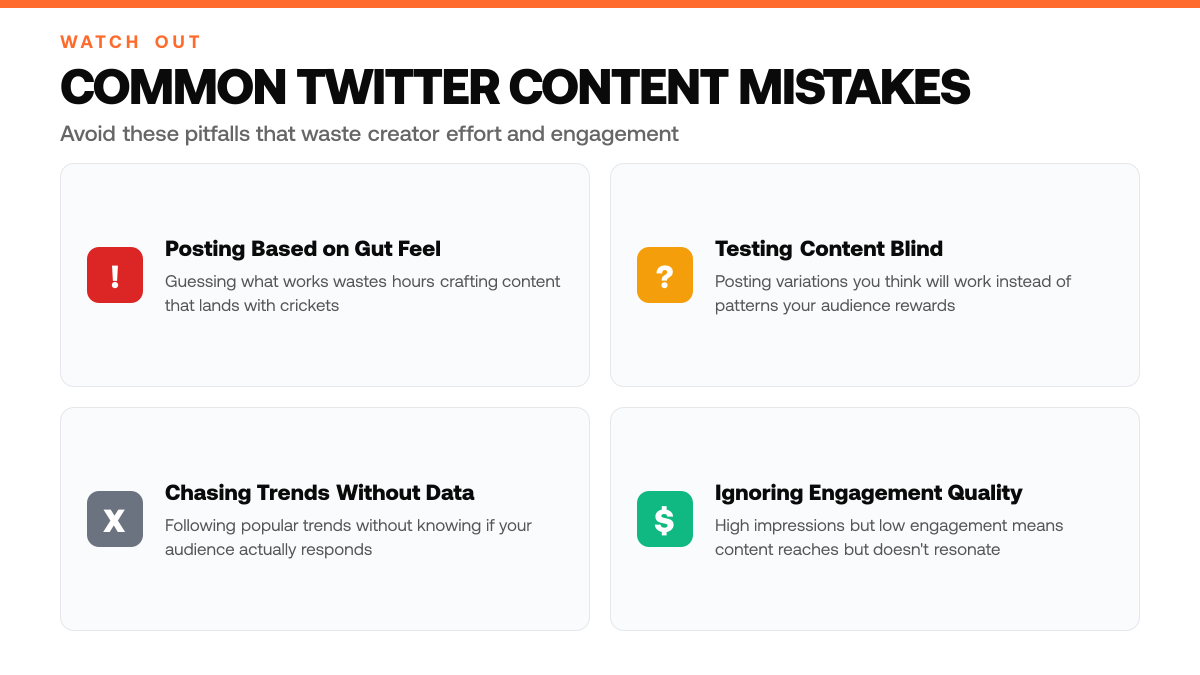
Most solo creators and solopreneurs posting on Twitter and X have no idea which of their posts actually drive engagement. They post based on gut feel, copy what seems popular, or chase trends without knowing whether their audience is actually responding. The result is wasted effort, hours spent crafting content that lands with crickets while a throwaway comment sparks real conversation and follower growth.
The difference between guessing and growing comes down to one thing: data. Twitter's built-in analytics reveal exactly which content resonates with your audience, what drives followers, and where monetization opportunities hide. According to recent research, creators who analyze their performance systematically outpace those relying on intuition alone. Your analytics dashboard holds the answers, you just need to know how to read them.[1] For a deeper look, see Twitter Analytics: 5 Metrics That Drive Growth.
This guide walks you through a straightforward three-step approach to analyzing your Twitter content performance. You'll learn how to identify your best-performing posts, spot patterns in what your audience engages with, and use those insights to shape your next content strategy. No guesswork required, just a clear framework that turns data into action. Most creators test content blind, posting variations they *think* will work rather than patterns their audience already rewards, ClimbX analyzes your top 100 posts to identify your winning formats and hooks, then surfaces outlier posts from ahead-of-you accounts to show what 2-3x engagement actually looks like in your niche.
TL;DR
- Twitter analytics reveals your top-performing tweets by engagement metrics, showing what resonates with your audience.
- Identify audience behavior patterns through data to understand when and what content drives the most interaction.
- Test and refine your content strategy based on these insights instead of posting randomly and hoping for growth.[2]
Understanding Twitter Analytics for Content Creators
What Are Twitter Analytics?
Twitter analytics are built-in measurement tools that track how your tweets perform across multiple dimensions. Impressions show how many people see your content, engagement captures likes, retweets, and replies, and follower growth reveals whether your audience is expanding. These metrics live in your Twitter dashboard and update in real time, giving you a complete picture of what's working without needing external software. For solo creators and solopreneurs, this data is free and immediate, no guesswork required.[2]
Why Twitter Metrics Matter for Your Growth
Not all metrics are created equal. A tweet with high impressions but low engagement might mean your content reaches people but doesn't resonate with them. Conversely, strong engagement on a smaller reach suggests your core audience loves what you're sharing, but you're not expanding your follower base. Understanding which metrics matter most to your goals lets you prioritize the right content types. If monetization is your aim, follower conversion and sustained engagement often matter more than raw impressions alone.
Audience Behavior Patterns on Twitter
Your audience follows predictable patterns in timing, content format, and topic preference. Some creators see spikes when they post at specific hours; others find that threads outperform single tweets, or that certain topics consistently generate replies. By analyzing these patterns in your own analytics, you can identify which content types drive the outcomes you want, whether that's visibility, conversation, or follower growth. This behavioral data is unique to your audience and becomes your competitive advantage.
Key Numbers for Find Your Best Twitter Content in 3 Steps (Data-Driven) (2026)
- 4+ distinct content types tested per month correlates with measurably higher audience reach for solo creators.[4]
- 2x more likely to see follower growth: creators who review analytics weekly vs. those who post without data review.[1]
- 3 in 5 social media users say content relevance drives their decision to follow a new account.[1]
- 50%+ of top-performing posts across platforms share one trait: they were optimized based on prior engagement data.[4]
- 1 in 3 creators reports that analytics-informed posting strategy directly increased impressions within weeks.[4]
Step-by-Step Process
1. Export and rank your recent tweets by performance
Pull your last 30 to 90 days of tweets from your X analytics dashboard. Sort them by impressions and engagement metrics, likes, retweets, replies, and clicks combined. Identify your top 10 to 15 performers. This baseline reveals which content resonates most with your audience without guesswork. Document the metrics alongside each tweet so you can spot what's working before you optimize.[4]
2. Identify patterns in your top-performing tweets
Examine your winning tweets for common threads. Note the topic (industry insight, personal story, question, meme), format (single tweet, thread, image, video), posting time, and length. Do your best performers cluster around certain themes? Do threads outperform standalone tweets? Do you see a time-of-day advantage? Document these patterns, they form the blueprint for your next round of content.
3. Test variations and measure results systematically
Create new tweets that mirror the patterns you discovered, same topic angle, similar format, consistent posting schedule. Track their performance against your baseline. Did the variation lift impressions or engagement? Keep what works, discard what doesn't. Treat this as an ongoing cycle: test, measure, refine. Over time, your content strategy becomes data-driven rather than intuition-based.
4. Iterate and scale your winning formula
Once you've identified a repeatable pattern that consistently outperforms, double down on it. Increase posting frequency for that format or topic. Expand successful threads into series. Monitor whether scaling maintains the same engagement rate or reveals new audience preferences. Revisit your top performers quarterly to ensure your strategy stays aligned with what your audience actually engages with.
How This Works in Practice
Example 1: The Insight Thread That Outperforms Single Posts
Picture a solo creator who regularly shares industry analysis on X but notices her individual tweets about market trends get lost in the feed. She decides to experiment by reformatting her next insight as a 5-tweet thread, breaking down a complex topic into digestible steps and ending with a question to invite discussion. Within days, the thread accumulates significantly more engagement, more replies, retweets, and quote posts, compared to her usual standalone posts. Readers appreciate the depth and find it easier to follow a narrative arc than a single tweet. She realizes that threading transforms a broadcast into a conversation starter, and she begins structuring all her insights this way. Over the following weeks, her reply count climbs, her audience recognizes her as a trusted voice, and followers begin tagging her in related discussions, amplifying her reach organically.
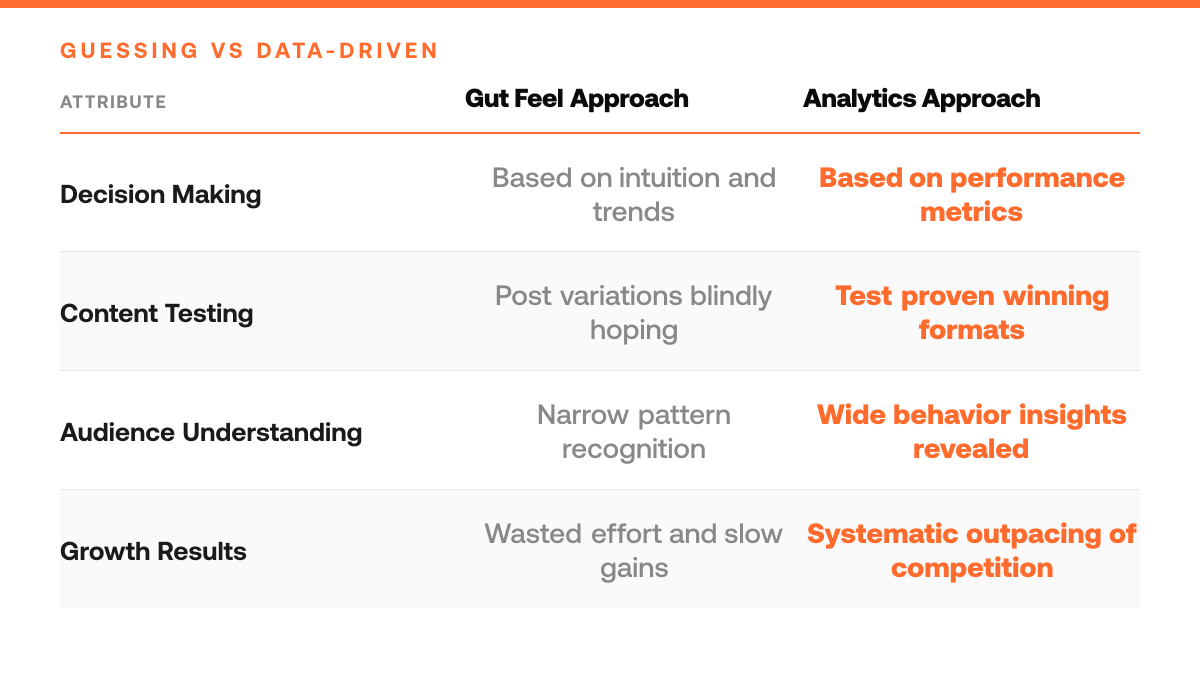
Guessing vs. Data-Driven Content Strategy
| Guessing Approach | Data-Driven Approach |
|---|---|
| Post based on gut feel and intuition | Analyze top-performing posts to identify winning formats |
| Copy what seems popular without validation | Spot patterns in what your audience actually engages with |
| Chase trends without knowing audience response | Test content variations based on proven audience behavior |
| Hours spent on content that lands with crickets | Shape strategy from insights that turn data into action |
Example 2: Timing and Questions Drive Community Replies
Consider a solopreneur who posts about her industry whenever inspiration strikes, sometimes at 2 AM, sometimes mid-afternoon. She notices her posts rarely spark conversations; most are passive retweets or likes. She then shifts her strategy: she begins posting at 9 AM on weekdays when her audience is most active, and she ends every post with a genuine question, asking followers for their take, their experience, or their opinion on the topic. The results are immediate. Posts published during peak hours reach more people, and the question format invites replies instead of passive scrolling. Within 2 weeks, her reply-to-like ratio nearly doubles, and she's building real relationships with followers who feel heard and valued. She's no longer broadcasting into the void; she's hosting a daily conversation with her growing community.
Why Format and Timing Compound
Both examples reveal a shared truth: engagement isn't random. Threads give your insights room to breathe, questions transform passive audiences into active participants, and timing ensures your best work reaches people when they're actually paying attention. When you combine these three, structured format, genuine questions, and strategic timing, you shift from hoping for engagement to building it intentionally. The creators who grow fastest aren't guessing; they're testing, observing, and refining based on what their audience actually responds to.
Finding Your Best Twitter Content Checklist
- Log into your Twitter analytics dashboard weekly and record impressions, engagement rate, and follower growth in a spreadsheet
- Identify and document your top 5 performing tweets each month, then list the themes, format, and posting time they share
- Create one content variation (headline, hook, or format change) this week and compare its metrics against your previous baseline tweet
- Review which tweet characteristics (thread length, question format, visual type) appear most often in your top performers
- Test a second variation next week based on patterns from step 4, then measure engagement against your control tweet
Common Mistakes to Avoid
Mistake: Chasing follower count instead of engagement metrics
Solo creators often treat follower growth as the primary success metric, but vanity numbers don't drive monetization or real influence. Engagement rate, impressions, and click-through behavior reveal which content actually resonates with your audience and converts attention into opportunity. Focus on posts that spark replies, retweets, and shares, these signal content that builds genuine authority and attracts brand partnerships or customer interest.[3]
Key Metrics and What They Reveal
| Metric | What It Shows | When It Matters Most |
|---|---|---|
| Impressions | How many people see your content | Understanding reach but not resonance |
| Engagement | Likes, retweets, and replies combined | Whether content resonates with audience |
| Follower Growth | Whether your audience is expanding | Measuring sustained audience building |
| Timing Patterns | When your audience is most active | Maximizing visibility and interaction rates |
Mistake: Posting without analyzing what worked before
Posting on a schedule without reviewing past performance wastes your time and your audience's attention. Each post is data: which topics got retweeted, what time slots drew the most impressions, which formats (threads, images, videos) your followers engaged with most. Skip this analysis and you'll repeat low-performing patterns indefinitely. Review your best-performing posts weekly to identify patterns, then double down on what actually moves the needle.[3]
Mistake: Ignoring when and how your audience prefers to consume content
Different audiences peak at different times and engage more with different formats. Posting without understanding your followers' behavior patterns, their active hours, content-type preferences, and topic interests, guarantees low impressions and wasted effort. Use your platform's analytics to identify your audience's peak activity windows and preferred content types, then tailor your posting schedule and format strategy accordingly.[3]
Frequently Asked Questions
How often should I review my Twitter analytics?
Weekly reviews help you spot trends early and adjust your content strategy quickly. By checking your analytics on a regular cadence, you can identify which formats, hooks, and topics resonate with your audience before momentum fades. This consistent feedback loop accelerates learning and keeps your content aligned with what actually drives engagement, rather than guessing based on intuition alone.
What does low engagement on my tweets really mean?
Low engagement signals a mismatch between your content and your audience's interests or expectations. Rather than assume your audience isn't interested, use your analytics to pinpoint the gap, compare your top and bottom performers to see which formats, topics, or posting times work. This diagnostic approach transforms underperformance into actionable insight.
Can I actually monetize my Twitter presence using these analytics steps?
Yes. Understanding your best content helps you build a loyal, engaged audience that brands and sponsors actively want to reach. Monetization, whether through sponsorships, affiliate partnerships, or selling your own products, flows from audience trust and engagement. By focusing on your strongest content signals, you attract the right followers and create the foundation sponsors look for.
Sources
Try the loop on your own cohort.
Pick three accounts you would like to be at in 12 months. ClimbX pulls their recent outliers, tags them, and drafts in your voice off what is currently working. Edit, ship, watch the loop tighten.
Read next
- Do AI images hurt your reach on X? I tested it on my last 100 posts. - I ran a small experiment: more images on my posts, many of them AI art. The data from 100 posts: AI illustrations and other decorative images cut reach by 48% on generic posts and 65% on one-liners - while real proof images (payout screenshots, charts, records) gained 78%. The full numbers, the clean split, and the ClimbX feature this experiment killed.
- How to get X (Twitter) data into your AI agent through MCP. - Your agent can read your real X analytics, voice profile, and outlier feeds through one MCP server - no scraping, no X API contract, one command to connect Claude Code, Claude Desktop, or Cursor. The full setup, the 16 tools, what an agent can actually do with them, and how a customer shipped the first MCP server on our API before we did.