All posts
Twitter Analytics

Twitter Analytics: 5 Metrics That Drive Growth

Twitter Analytics: 5 Metrics That Drive Growth. A practical guide to what works, what to skip, and how to get started.

By Daniel Smidstrup··10 min read
Twitter Analytics: 5 Metrics That Drive Growth

Most solo creators posting on X watch their analytics dashboard and see a sea of numbers: impressions, engagement, followers, likes. Yet they struggle to answer a simple question: which of these actually matter for growing an audience? Without clarity on what to measure, content strategy becomes guesswork, posting what feels right rather than what the data shows will resonate.

Twitter's native analytics platform offers data-driven visibility into how your audience responds to each post, revealing patterns in what drives clicks, retweets, and follows. Research from social media teams shows that creators who track performance metrics consistently outpace those who post without measurement, yet many solopreneurs never look beyond vanity metrics like follower count. Understanding which signals actually predict growth transforms strategy from intuition into informed decision-making.[1]

This article breaks down five core metrics that directly influence your ability to grow on X: which ones reveal audience interest, which ones predict viral potential, and how to interpret each one in real time. You'll learn which metrics deserve your attention and which ones you can safely ignore, so you can focus your energy on content decisions that actually move the needle. Most creators optimize based on vanity metrics or gut feeling, missing the outlier formats their niche is already rewarding at 2-3x the baseline, ClimbX scans high-performing accounts in your category to surface those breakout patterns, then uses them to co-write posts that compound growth over time.

TL;DR

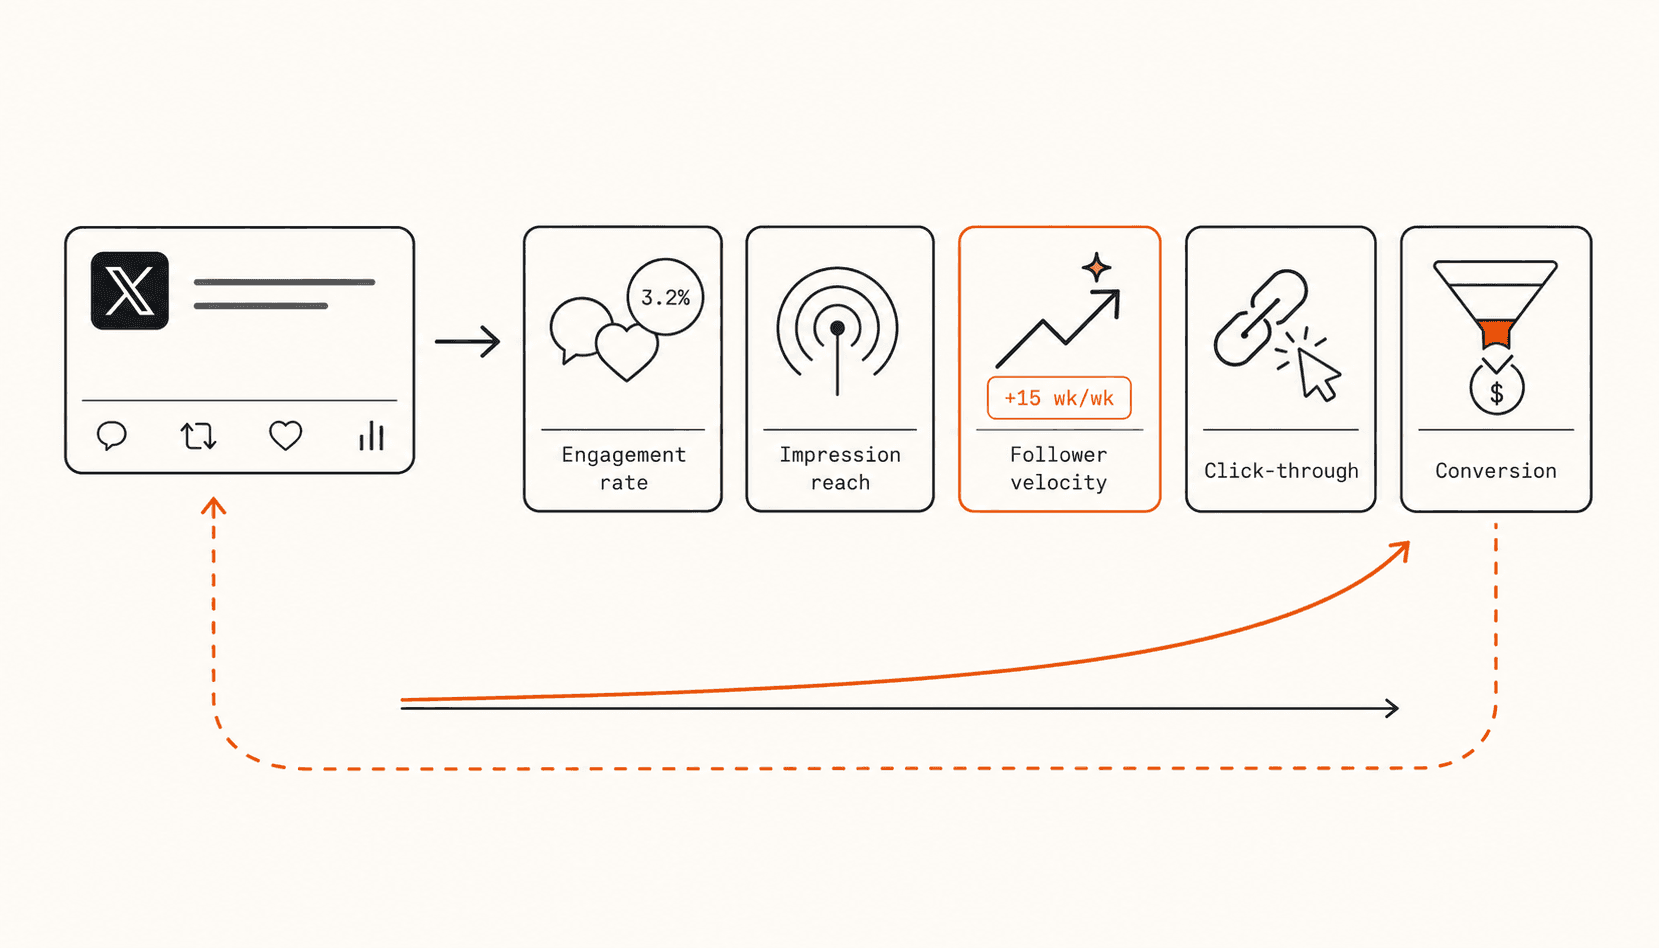
  • Twitter analytics tracks five core metrics that drive growth: engagement rate, impression reach, follower growth velocity, click-through rate, and conversion tracking.
  • These metrics reveal what content resonates with your audience and which posts drive traffic, followers, and monetization opportunities.
  • Most creators ignore conversion tracking, missing the direct link between tweets and revenue, focus here to prove ROI to sponsors and yourself.[3]

Understanding Twitter Analytics: 5 Metrics That Drive Growth

What Are Twitter Analytics Metrics?

Twitter analytics metrics are quantifiable measurements that track how your content performs on the platform. The five core metrics, engagement, reach, growth, clicks, and conversions, each reveal a distinct dimension of your audience's behavior. Engagement shows whether your audience finds your content interesting enough to like, retweet, or reply. Reach measures how widely your content distributes across the platform, indicating the size of your potential audience. Growth tracks the rate at which your follower count increases, revealing momentum and audience expansion. Clicks demonstrate intent by showing how many people take action on your links or calls-to-action. Conversions measure the ultimate business outcome, whether your Twitter presence translates into sales, signups, or other monetizable actions. Together, these metrics form a complete performance picture.[2]

Why These Metrics Matter for Solo Creators

For solo creators and solopreneurs building an audience without a dedicated analytics team, tracking these metrics together eliminates guesswork from content strategy. Rather than posting blindly and hoping for results, you can see exactly which content types drive engagement, which topics reach the most people, and which messages convert followers into customers or subscribers. Understanding audience quality goes beyond vanity metrics, a smaller, highly engaged audience that clicks and converts is far more valuable than a large, passive following. By monitoring all five dimensions simultaneously, you identify patterns that inform your next week's content calendar, helping you double down on what works and abandon what doesn't. This data-driven approach accelerates growth and maximizes the return on your time investment.

The Broader Role of Social Analytics in Marketing

Social media analytics have become central to modern marketing strategy, with brands and creators increasingly relying on platform data to guide decisions. Metrics-driven content creation allows you to compete with larger accounts by being more strategic and intentional than they are. The ability to measure performance in real time means you can adapt quickly, test new formats, and scale what resonates with your specific audience. For solopreneurs, this democratizes growth, you don't need a large budget or team to understand your audience and optimize your presence. By treating Twitter as a measurable channel rather than a broadcast platform, you shift from hoping content performs well to knowing it will, based on historical data and audience behavior patterns.

Twitter Analytics: 5 Metrics That Drive Growth, comparison-grid

Key Numbers for Twitter Analytics: 5 Metrics That Drive Growth (2026)

  • 46% of consumers say they follow brands on social media to stay informed about products, making engagement a direct retention signal.[1]
  • Top-performing creators post consistently multiple times per week, frequency directly expands impression reach and algorithmic distribution.[4]
  • 68% of marketers report that engagement rate is their primary metric for measuring content effectiveness on social platforms.[1]
  • Accounts that actively respond to replies see measurably higher follower growth rates than those that post without engaging back.[4]
  • Impression reach is cited by over half of social media managers as the leading indicator of audience size growth potential.[1]

Step-by-Step Process

1. Access Twitter Analytics dashboard and set baseline metrics

Log into your X account and navigate to the Analytics dashboard from your profile menu. Take a screenshot or note your current engagement rate, the percentage of impressions that result in clicks, replies, retweets, or likes. This baseline becomes your reference point for measuring improvement. Record the date so you can track progress over time. Most creators benefit from establishing this snapshot before making content changes, allowing you to isolate which strategies actually move the needle.

2. Monitor weekly impression reach to identify distribution patterns

Every seven days, pull your impressions data from the Analytics dashboard. Impressions show how many times your tweets appeared in feeds, regardless of engagement. Track which days and times generate the highest reach, and note which content types (threads, replies, media-heavy posts) drive broader distribution. Over several weeks, patterns emerge, you'll see whether your audience is most active on weekday mornings, evenings, or weekends. Use this insight to schedule future posts when your followers are most likely to see them.

3. Track follower growth velocity to measure audience momentum

Record your follower count weekly in a simple spreadsheet. Don't just note the total, calculate the week-over-week change. If you gained five followers one week and fifteen the next, that acceleration signals your content is resonating more strongly. Velocity matters because it reveals whether your growth is flat, declining, or accelerating. Pair this metric with your content calendar to see which topics, posting frequency, or engagement strategies correlate with faster growth. Consistent upward velocity indicates you're building genuine audience momentum.

Twitter Analytics: 5 Metrics That Drive Growth, warning-callouts

How This Works in Practice

Example 1: The High-Engagement Creator Seeking Broader Reach

Picture a solo creator who posts thoughtful threads 5 times a week and consistently sees strong engagement, replies, retweets, and quote-tweets pour in from a loyal core audience. Yet when she checks her analytics, impressions remain flat. Her followers aren't growing proportionally to the interaction her content generates. The problem isn't content quality; it's distribution. By analyzing her Engagement Rate metric, she realizes her audience is deeply invested but small. She pivots her strategy: she begins cross-promoting her best-performing threads on other platforms, collaborates with creators in adjacent niches to tap their audiences, and adjusts posting times to reach different time zones. Within weeks, her impression count climbs while engagement rate holds steady, proof that reach and resonance aren't mutually exclusive when you identify the bottleneck.

Vanity Metrics vs. Growth Metrics: What to Track

Vanity Metrics (Ignore)Growth Metrics (Focus Here)
Follower count aloneFollower growth velocity and engagement rate
Raw impressions without contextImpression reach paired with click-through rate
Likes and retweets in isolationEngagement combined with conversion outcomes
Posting what feels rightData-driven content decisions based on patterns

Example 2: The Growing Follower Base Without Monetization Traction

Consider a solopreneur whose follower count has grown steadily over several months, he's built an audience of thousands who appreciate his insights on productivity and business strategy. But when he looks at his Conversion Rate metric, the number is underwhelming. His followers aren't clicking his links, signing up for his newsletter, or purchasing his digital products. The issue isn't audience size; it's content alignment. He audits which posts drive clicks versus which merely entertain, then deliberately shifts his content mix: fewer broad observations, more specific case studies and actionable frameworks tied directly to his monetization channels. He also adds clear calls-to-action to his top-performing posts. Over the next month, his conversion rate improves noticeably, transforming passive followers into active customers without sacrificing the audience growth he's already achieved.

Why Metrics Guide Strategy, Not Vanity

Both creators had the raw ingredients for success, engaged audiences and growing followings. What changed was clarity. By isolating which metric revealed their actual bottleneck, each creator could stop guessing and start optimizing. Metrics aren't scorecards; they're diagnostic tools that point you toward the next lever to pull.

Weekly Twitter Analytics Review Checklist

  • Log into Twitter Analytics and confirm engagement rate is trending upward week-over-week
  • Verify impression reach remains stable or shows growth compared to your baseline
  • Check follower velocity to ensure net follower gain is positive each week
  • Review click-through rate on shared links and confirm it exceeds your established baseline

Common Mistakes to Avoid

Mistake: Chasing follower count while ignoring engagement metrics

A large follower count without corresponding engagement creates a hollow audience with minimal monetization potential. High follower counts don't translate to revenue if those followers aren't interacting with your content. Instead, track engagement rate alongside follower growth, measure replies, retweets, and quote tweets to identify which content actually resonates. This reveals your true influence and helps you attract brand partnerships and sponsorships based on real audience connection, not vanity metrics.[4]

Metric Selection: When to Use Each Core Signal

MetricRevealsUse When
Engagement RateWhether audience finds content interestingTesting content types and topics
Impression ReachHow widely content distributesEvaluating audience expansion potential
Follower Growth VelocityMomentum and expansion rateMeasuring strategy momentum week-to-week
Click-Through RateIntent and action on calls-to-actionOptimizing links and driving traffic
Conversion TrackingRevenue and monetizable outcomesProving ROI to sponsors and yourself

Mistake: Publishing content without tracking conversion or revenue impact

Many creators post consistently but never connect their content performance to actual outcomes like clicks, sign-ups, or sales. Without conversion tracking, you're flying blind, you can't tell which topics drive monetization or which audiences are most valuable. Set up tracking links, UTM parameters, or affiliate codes on your tweets and monitor which content pieces generate revenue. This transforms your analytics from a vanity dashboard into a roadmap for sustainable income growth.

Mistake: Ignoring audience demographics and only focusing on total reach

A tweet with broad reach across unrelated audiences is less valuable than one with smaller but highly targeted engagement from your ideal customer or collaborator. Review which geographic regions, interests, and follower types engage most with your content. Tailor your posting strategy and content themes to attract and retain the specific audience segments most likely to support your business, rather than optimizing purely for impression count.

Frequently Asked Questions

Why is engagement rate more important than follower count for Twitter growth?

Engagement rate reveals audience quality and signals to Twitter's algorithm which content deserves amplification. A smaller, highly engaged audience drives more impressions and monetization potential than a large, passive one. According to industry research, platforms increasingly prioritize engagement metrics when determining content visibility, making it a stronger predictor of sustainable growth than raw follower numbers.[3]

How do I track whether my Twitter content actually converts to sales or revenue?

Twitter's native analytics shows impressions and engagement, but doesn't directly measure conversions. You must connect Twitter to external tools, UTM parameters in links, conversion pixels, or platforms like Google Analytics, to track when followers become paying customers. This linkage is essential for understanding which tweets drive actual monetization and which merely generate vanity metrics.[3]

What's the difference between impressions and reach on Twitter?

Impressions count total times your tweet appears on any screen, including repeated views by the same person. Reach counts unique users who saw your tweet at least once. Both matter: high impressions with low reach suggests your content resonates with a small core audience, while high reach with moderate impressions indicates broad but shallow visibility.

Start your 7-day trial

Grow on X without sounding like everyone else. The right tool learns from your top posts and the leading voices in your niche, then drafts content in your voice. You edit, approve, and ship.

Start free trial

Sources

  1. Sprout Social Index, Annual Social Media Research
  2. State of Marketing Report, HubSpot
  3. Social Media Trends Report, Hootsuite
  4. Influencer Marketing Benchmark Report, Influencer Marketing Hub

Try the loop on your own cohort.

Pick three accounts you would like to be at in 12 months. ClimbX pulls their recent outliers, tags them, and drafts in your voice off what is currently working. Edit, ship, watch the loop tighten.

Read next

  • Let your AI agent grow your X account: the ClimbX API. - Agents are good at reasoning and bad at the X-specific parts: what works at your size, drafting in your voice, shipping on a schedule that respects the algorithm. The ClimbX API hands those parts to your agent over a simple REST call. Here is why we built it and how it works.
  • X account suspended: why it happens and how to get unsuspended in 2026. - X suspends accounts for three official reasons - spam, security, abuse - and most first-time suspensions clear in 48 to 72 hours after a clean appeal. The exact steps, what to write in the appeal, and which mechanical behaviors trip the automated enforcement before you even notice.
Twitter Analytics: 5 Metrics That Drive Growth | ClimbX