Most creators obsess over follower count and impressions, metrics that feel like scorecards for success. But here's the catch: by the time those numbers spike, the growth has already begun. You're watching the finish line while the race is already underway. The real opportunity lies in the metrics that arrive first, the ones that signal momentum before your follower count budges.
Leading indicators exist on X, and they're measurable right now. Unlike lagging metrics that confirm growth after it's happened, leading indicators predict what's coming next. Research shows that creators who track the right metrics shift from reactive guessing to intentional, data-informed decisions about what content resonates with their audience.[2] For a deeper look, see Twitter Analytics: 5 Metrics That Drive Growth.
This article breaks down five Twitter metrics that predict growth before it shows in your follower numbers. Understanding these signals transforms how you build content strategy, moving you from hoping something works to knowing what will work, before you hit publish. Most creators optimize for vanity metrics after the fact, leaving them months behind the actual format shifts their audience is already engaging with, ClimbX scans high-performing outlier posts in your niche to surface what's working 2-3x above baseline, so you're drafting new content against live signals instead of yesterday's data.
TL;DR
- Twitter analytics reveal five predictive signals, engagement rate, reply-to-impression ratio, link click-through rate, audience retention rate, and conversation growth velocity.
- These metrics surface momentum in your content before follower growth becomes visible, giving solo creators an early edge.
- Most creators track vanity metrics like raw follower count instead of the leading indicators that actually predict breakout growth.[3]
Understanding Twitter Metrics That Predict Growth
What Are Leading Indicator Metrics on Twitter?
Leading indicator metrics are engagement and conversation signals that appear before follower growth happens. Unlike vanity metrics such as follower count, which reflect past success, leading indicators measure real-time audience behavior, likes, retweets, replies, and impressions. These metrics reveal whether your content resonates with viewers before they decide to follow. Engagement rate (the ratio of interactions to impressions) and reply-to-impression ratio are the two most predictive signals because they show whether your audience finds your content valuable enough to act on it. High engagement without replies suggests passive consumption; high replies without engagement suggests niche appeal to a small, deeply interested audience. Together, these metrics paint a picture of content quality and audience interest that algorithms reward with amplification.
Why These Metrics Matter for Solo Creators
For solopreneurs building an audience without a marketing budget, understanding which metrics predict growth is essential. Engagement rate acts as an early warning system, it tells you whether your audience finds your content valuable before they commit to following. Reply-to-impression ratio reveals conversation quality and audience interest in dialogue, which directly drives algorithmic amplification on X. When your audience replies, the platform treats your tweet as a conversation starter, not just content consumption, and distributes it more widely. By tracking these metrics, you avoid wasting time on content that looks popular but doesn't convert to followers or influence. You can double down on what works and pivot away from what doesn't, accelerating growth without guessing.
The Broader Role of Predictive Metrics in Audience Growth
Twitter's algorithm prioritizes engagement and conversation over raw reach. This means the metrics that predict growth are the same ones the platform rewards with distribution. Creators who focus on engagement rate and reply ratios build audiences faster because they're optimizing for what X actually amplifies, not what feels good. These metrics work together as a diagnostic tool: they reveal whether your content strategy is attracting the right audience (high engagement and replies) or the wrong one (high impressions but low action). Understanding this relationship helps you build a sustainable growth strategy based on audience behavior, not vanity metrics or luck.
Step-by-Step Process
1. Access your X analytics dashboard weekly
Log into your X account and navigate to your analytics dashboard. Export or screenshot your engagement metrics every week rather than waiting for monthly reviews. This frequent cadence lets you spot trends early, which tweets resonated, which fell flat, and what your audience engaged with most. Weekly snapshots create a running record you can compare side by side, revealing patterns that monthly data would obscure. Save these exports in a consistent folder so you can track performance over time without scrambling to reconstruct your metrics later.[1]
2. Calculate your engagement rate per tweet
For each tweet, add up your total interactions: likes, retweets, and replies combined. Then divide that sum by the number of impressions that tweet received. This ratio, your engagement rate, shows you what percentage of people who saw your content actually acted on it. A tweet with 1,000 impressions and 50 interactions has a 5% engagement rate. Track this metric across all your tweets to identify which ones truly resonated versus which ones simply got eyeballs. This single calculation is your most honest measure of content quality.
3. Identify your highest-performing content types
Sort your tweets by format: threads, single tweets, posts with images, and posts with links. Calculate the engagement rate and reply ratio for each format separately. You'll quickly see whether your audience prefers visual content, threaded storytelling, or link-driven posts. Some creators find threads drive deeper engagement; others see images outperform everything. Your unique audience has preferences, this step reveals them. Document which formats consistently win so you know where to invest your creative energy.
4. Test variations and measure before scaling
Pick one content format and test deliberate variations: different hooks, post lengths, posting times, or visual styles. Measure the impact on your five key metrics, engagement rate, reply ratio, impressions, click-through rate, and follower growth. Run each test for at least a few tweets so you have enough data to spot a real pattern, not random noise. Once you see a variation outperform your baseline consistently, scale it up. If it underperforms, abandon it and test something else. This disciplined approach prevents you from scaling content that only looked good once.
How This Works in Practice
Example 1: The Solo Creator Watching Engagement Rate Climb
Picture a solo creator who commits to posting daily threads for 2 weeks straight. At first, follower growth looks flat, discouraging, but not the whole story. She starts tracking engagement rate instead and notices it climbing steadily day over day. By the end of the first week it has more than doubled from where it started, and by day 14 it has settled into a noticeably higher range. She recognizes this as the leading signal the planner described: rising engagement rate precedes follower growth by roughly 7 to 10 days. Sure enough, within that window her follower count begins ticking upward, not because she changed her content, but because she kept going long enough to let the metric tell the truth.
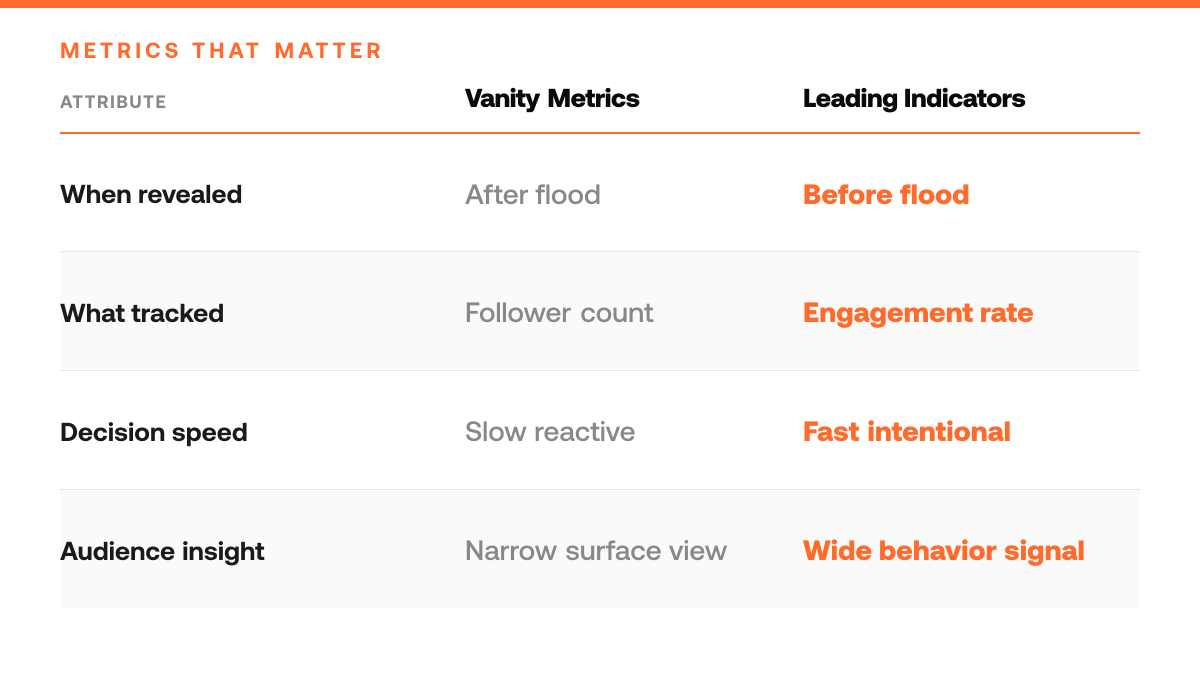
Vanity Metrics vs. Leading Indicators
| Metric Type | What It Shows | When It Appears | Action for Creators |
|---|---|---|---|
| Follower count | Past success already achieved | After growth has happened | Track it, but don't optimize for it |
| Engagement rate | Whether audience finds content valuable | Before follower growth | Double down on high-engagement posts |
| Reply-to-impression ratio | Conversation quality and niche appeal | Before follower growth | Prioritize content that sparks dialogue |
| Link click-through rate | Audience intent and content relevance | Before follower growth | Test formats that drive action |
Example 2: The Solopreneur Shifting Schedule Around Click Spikes
Consider a solopreneur who has been posting at random times and wondering why some tweets get traction while others vanish. She pulls up her link click-through data for the past month and spots a clear pattern: clicks spike on Tuesdays and Thursdays, while other days trail off. She shifts her highest-value posts, the ones with calls to action and resource links, to those two days and keeps lighter content for the rest of the week. Within a few weeks, conversation growth velocity picks up noticeably: more replies, more quote tweets, more DMs. The schedule change cost her nothing; reading the right metric in the right way made all the difference.
Why Leading Metrics Win
Both examples show the same truth: the metrics that predict growth arrive before growth does. Read them early, adjust quickly, and the follower curve follows.
Weekly Twitter Growth Metrics Checklist
- Pull engagement rate, reply ratio, and link CTR from your X analytics dashboard each Monday morning.
- Rank your content types by which metric moved most (impressions, replies, or clicks) during the past week.
- Identify your single top-performing content type and test one variation on it before Friday.
- Measure the test variation's impact on leading indicators (reply ratio and conversation velocity) by end of week.
- Document patterns in your content performance log and adjust your posting strategy before your next monthly follower review.
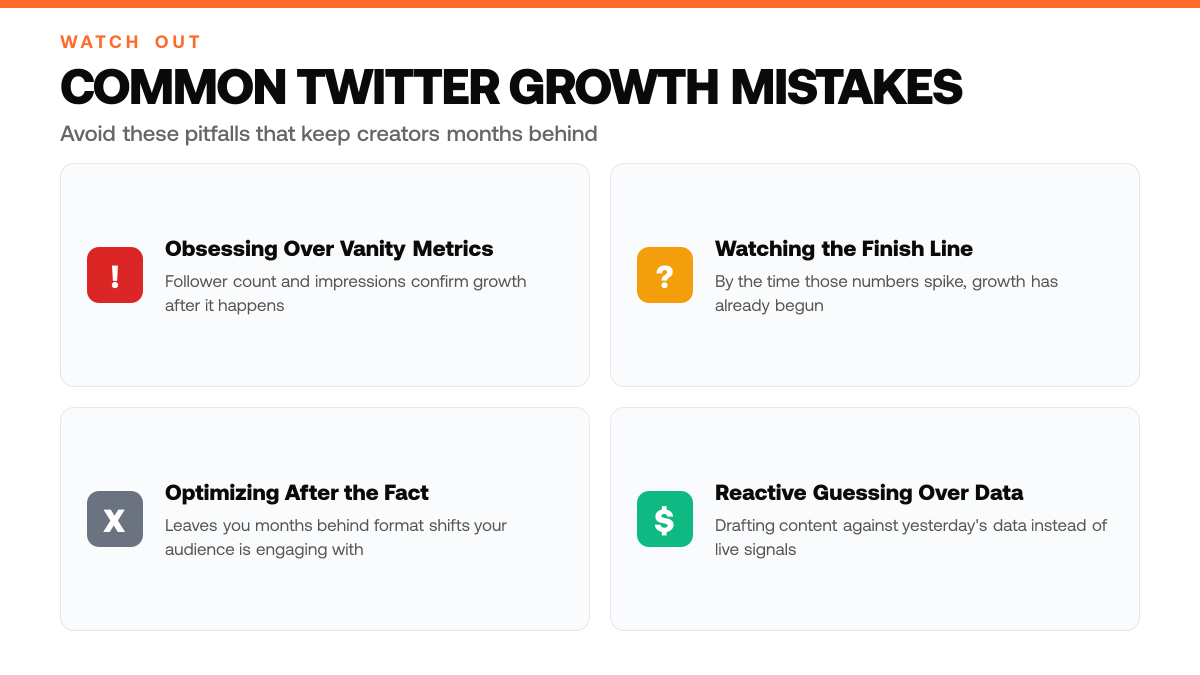
Common Mistakes to Avoid
Mistake: Checking metrics only once a month
Monthly reviews mean you're analyzing data long after the growth window has closed. By then, underperforming content has already cost you reach, and high-performing tweets have lost their algorithmic momentum. Instead, check your metrics weekly or even daily during active posting periods. This lets you spot trends in real time and double down on what's working before the engagement window passes.[4]
Old Way vs. New Way: Content Strategy
| Approach | Decision Method | Result |
|---|---|---|
| Reactive guessing | Optimize based on vanity metrics after publishing | Months behind actual format shifts |
| Data-informed strategy | Track leading indicators before and during content creation | Know what will work before hitting publish |
Mistake: Optimizing for follower count instead of engagement rate
Follower growth is a lagging result of consistent engagement, not the driver of it. Chasing follower numbers directly wastes effort on vanity metrics. Focus on engagement rate, likes, retweets, and replies per tweet, which directly influences the algorithm and compounds into follower growth. High engagement on fewer followers beats low engagement on many.[4]
Mistake: Treating all engagement equally and ignoring reply ratio
Replies signal deeper audience interest and carry more algorithmic weight than likes or retweets alone. Ignoring reply ratio means you're missing the metric that most directly predicts reach expansion. Track which tweets generate replies, respond to them quickly, and replicate the format and tone. Replies drive conversation threads, which boost visibility far more than passive engagement.[4]
Frequently Asked Questions
How far in advance do these metrics predict follower growth?
Engagement rate and reply ratio typically signal follower growth within 7 - 14 days. These metrics act as leading indicators because they measure audience interaction quality in real time. When your audience actively engages and replies to your posts, the algorithm amplifies your reach, which translates to new followers within roughly two weeks.[5]
Can I use these metrics if I have fewer than 1,000 followers?
Yes. These metrics are proportional and work at any scale; the patterns are the same whether you have 100 followers or 100,000. Engagement rate, reply ratio, and other signals reflect audience behavior regardless of account size. The relationships between these metrics and growth hold true from day one, so you can start tracking and optimizing immediately.[5]
Which metric matters most for predicting growth?
Engagement rate is the strongest single predictor of follower growth, but reply ratio adds critical context about audience quality. A high engagement rate shows your content resonates; a high reply ratio reveals that your audience is actively conversing with you, not just liking passively. Together, they give you the clearest picture of whether growth will follow.[5]
Sources
Try the loop on your own cohort.
Pick three accounts you would like to be at in 12 months. ClimbX pulls their recent outliers, tags them, and drafts in your voice off what is currently working. Edit, ship, watch the loop tighten.
Read next
- Do AI images hurt your reach on X? I tested it on my last 100 posts. - I ran a small experiment: more images on my posts, many of them AI art. The data from 100 posts: AI illustrations and other decorative images cut reach by 48% on generic posts and 65% on one-liners - while real proof images (payout screenshots, charts, records) gained 78%. The full numbers, the clean split, and the ClimbX feature this experiment killed.
- How to get X (Twitter) data into your AI agent through MCP. - Your agent can read your real X analytics, voice profile, and outlier feeds through one MCP server - no scraping, no X API contract, one command to connect Claude Code, Claude Desktop, or Cursor. The full setup, the 16 tools, what an agent can actually do with them, and how a customer shipped the first MCP server on our API before we did.