

The short version
The best Twitter analytics tools in 2026: X’s own analytics for basic numbers, Typefully for cheap stats inside a scheduler, Circleboom for follower tracking, Tweet Hunter for analytics plus automation, Metricool and Sprout Social for teams, and ClimbX for working out what to post next.
Paid tools start at $99 a year (Typefully) and run to $99 a seat a month (Sprout Social). If you post alone and want to grow, you don’t need a team dashboard. You need a tool that tells you which of your posts worked and why.
- 28 days
- Free analytics in Pro Home
- 30 days
- Max per X CSV export
- $8.25
- Cheapest paid tool, per month
- 6
- Paid tools compared
I grew my own X account from 0 to 10K followers in 137 days. This post compares the tools by price and by what each one is good at. Every price comes from the vendor’s own pricing page, checked October 25, 2026. If you want to know which numbers to watch first, read Twitter analytics: where to find it and 5 metrics to track.
What X’s own analytics shows, free and paid
X gives you some numbers for free. The full analytics page in the app needs a paid plan. Here is what you get at each level.
| Where | Cost | What you see |
|---|---|---|
| View count on each post | Free | Views, for anyone, on any post |
| Professional Home | Free (Professional Account) | Account analytics for the past 28 days |
| Post Activity dashboard | Free with an ads account | Impressions, engagements and engagement rate per post, CSV export |
| Analytics page in the X app | Plus ($8/mo) and up | Daily insights on how posts perform |
From X Help: view counts, Professional Accounts, X Business: Post Activity dashboard and @Subscriptions, June 13, 2024 and the SpaceXSI pricing page, checked October 25, 2026.
The Post Activity dashboard is the most detailed free option. X’s business help says it shows impressions, engagements, link clicks, reposts, likes and replies for each post. It defaults to the last 28 days. You can export up to 30 days at a time, with a cap of 3,000 posts per file.
X announced “a new and improved analytics page” in June 2024 and said to “upgrade to Premium to get daily insights.” X has renamed its plans since. The old $8 Premium tier is now Plus on The X Subscription, and the SpaceXSI pricing page lists Advanced Analytics for Plus. Check the sign-up screen before you pay.
Twitter analytics tools compared
Pick by the job you need done. A scheduler with stats, a follower tracker and a team reporting suite are three different products.
| Tool | From (per month) | Best for |
|---|---|---|
| X Plus | $8 (The X Subscription) | Basic native numbers |
| Typefully | $8.25 ($99 a year, yearly only) | Stats inside a clean scheduler |
| Tweet Hunter | $29 | Analytics plus automation and a viral post library |
| ClimbX | $29 | Knowing what to post next, for a solo account |
| Circleboom | $31.99 | Follower and unfollower tracking |
| Metricool | $25 + $10 X add-on | Many networks on a small budget |
| Sprout Social | $99 a seat ($79 yearly) | Teams reporting to a boss or client |
- Typefully Creator$8.25 · $99 a year, yearly only
- Tweet Hunter Discover$29
- ClimbX$29
- Circleboom Pro$31.99
- Metricool Starter + X add-on$35 · $25 + $10
- Sprout Social Essentials$99 · per seat
Typefully: cheap stats inside a scheduler
Typefully is a writing and scheduling tool with X analytics on top. The Creator plan is $99 a year, billed yearly only, and includes X analytics. Business is $20 a month per social set ($18 billed yearly). It adds detailed metrics, profile conversion rate, tweeting streaks and CSV download. The free plan has no analytics.
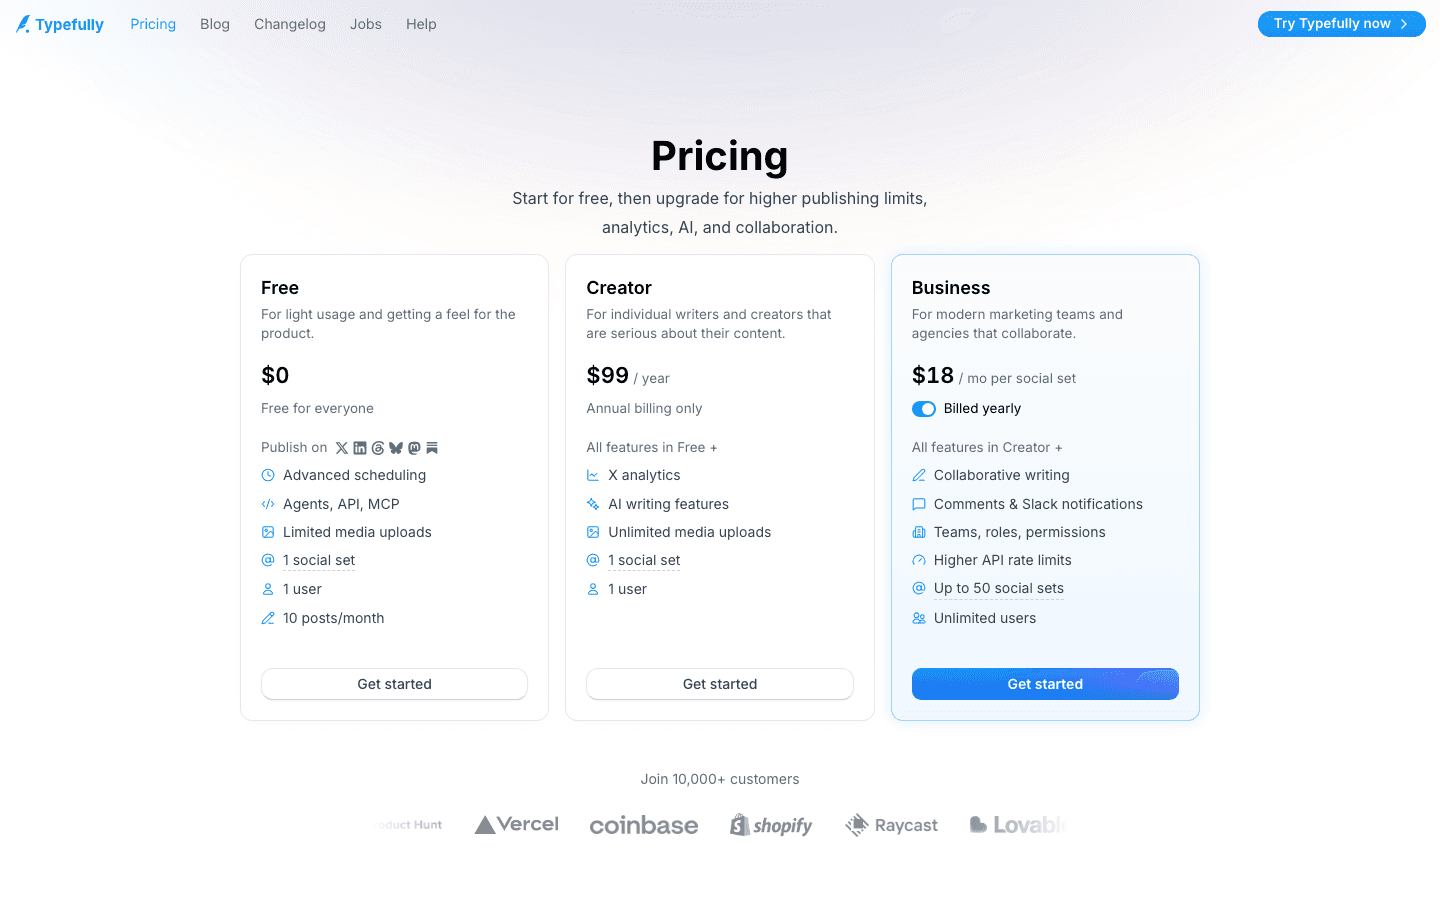
Pick it if you mostly want a nice place to write and schedule, and basic numbers are a bonus. More options in Typefully alternatives.
Tweet Hunter: analytics plus automation
Tweet Hunter lists “Complete X Analytics” on every plan. Discover is $29 a month for one account, Grow is $49 for five accounts, and Enterprise is $200. Discover also includes scheduling, a library of over 12 million viral tweets, auto-plug, auto-retweet and 3,000 auto-DMs a month.
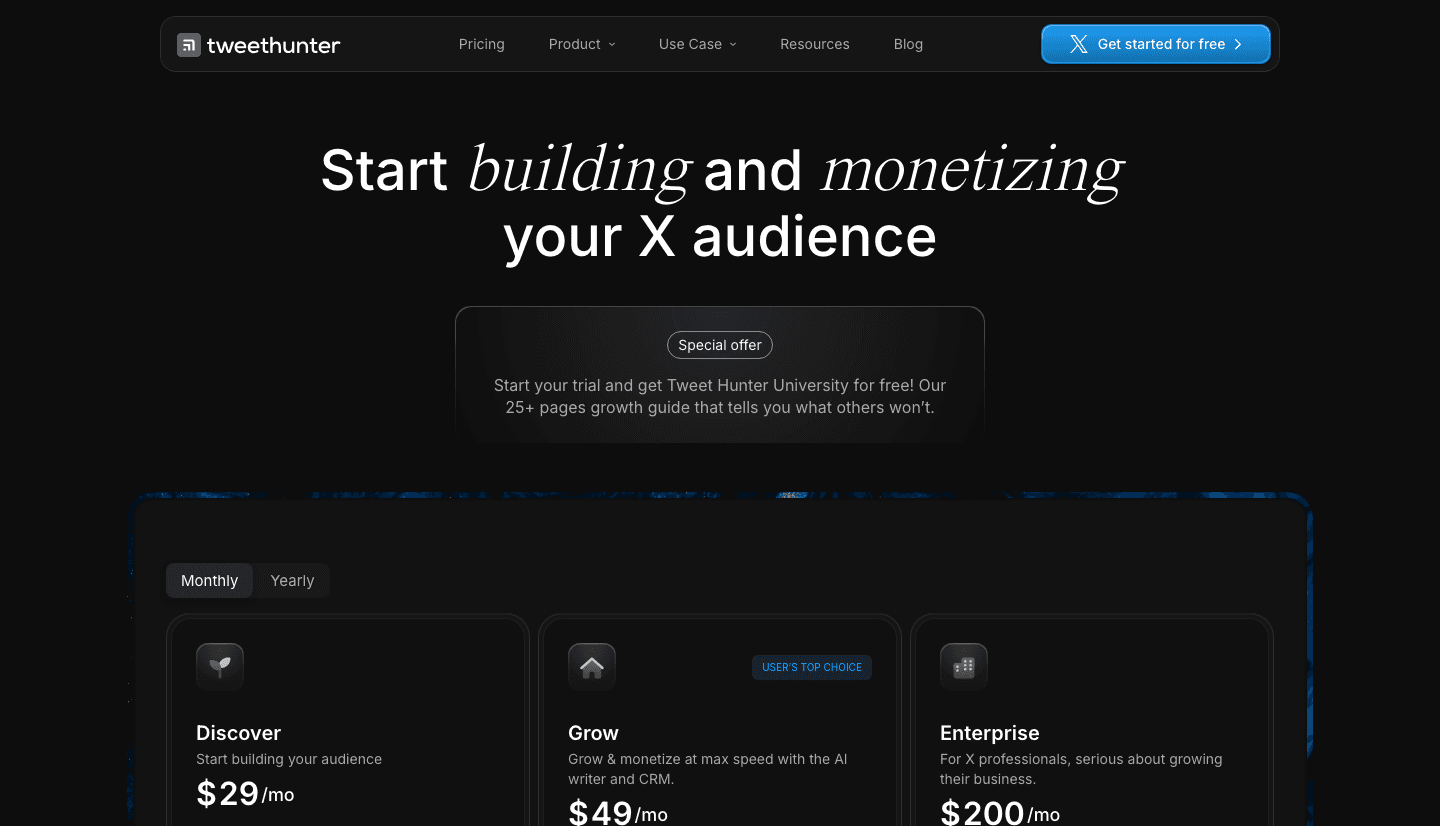
Pick it if you want automation in the same tool. If you don’t, you pay for features you won’t use. Compare it in ClimbX vs Tweet Hunter.
Circleboom: follower tracking
Circleboom Twitter is built around your follower list. Pro is $31.99 a month ($23.99 billed yearly) and includes account analytics, post analytics and follower tracking. Its Who Unfollowed Me feature only works for accounts with up to 25,000 followers. The cheaper Limited plan ($16.24 a month) has no analytics.
Pick it if you want to clean up your following list or see who left. Just want your count over time? The free Twitter follower tracker does that without an account.
Metricool: many networks on a small budget
Metricool covers Instagram, TikTok, LinkedIn and more. X is an add-on: $10 a month per connected account, on top of Starter from $25 a month. Starter gets “reduced” X analytics. Complete X analytics needs Advanced, from $67 a month. Metricool also says X metrics are stored for 30 days only. The free plan does not connect X at all.
Pick it if X is one of five networks you report on. For an X-first account, the 30-day limit hurts.
Sprout Social: team reporting
Sprout Social is a full social media suite for teams. Essentials is $99 per seat a month ($79 billed yearly) for up to 5 profiles, with profile and post-level reporting. Standard is $199 a seat. Premium Analytics is a paid add-on from Standard up. There is a 30-day free trial with no card.
Pick it if you report to a boss or a client across many networks. For a solo founder it is far more tool, and price, than you need.
ClimbX: what to post next
ClimbX is the tool I built. Its analytics answer one question: what should you post more of? It reads your own posts and shows:
- 1
Four headline numbers
Followers, posts, impressions and engagements, each with the change against the period before and a small daily chart. Pick 7, 30 or 90 days, all time, or your own dates. - 2
Your best formats and topics
Ranked by replies or impressions per post. Only formats and topics with 3 or more posts count, so one lucky post does not fool you. Tap a row to see its best posts. - 3
Posts to learn from
Your top post next to one that landed below your usual reach, side by side. - 4
Your best time to post
Median views by the hour you posted, with your strongest window. Viral breakouts are left out so they do not skew it. - 5
A weekly report
Average reach per post, your main takeaway, your strongest patterns and what to try next.
The same data is open to AI agents through the ClimbX MCP server, so you can ask Claude for your weekly report or best formats in plain words. ClimbX also drafts posts in your voice. You edit and approve every one before it goes out. From $29/month, with a 7-day trial for $1.
Pick it if you post on X alone and want the numbers to turn into your next post. Skip it if you need reports for other networks.
Which Twitter analytics tool should you pick?
Start from what you will do with the numbers.
- 1Do you report on many networks?Yes: Metricool or Sprout Social
- 2Do you mostly want follower lists?Yes: Circleboom
- 3Do you want to know what to post next?Yes: ClimbX. Just basic stats: Typefully or X itself
Worth paying for
- Your posts grouped by format and topic
- A best time to post from your own data
- History longer than 30 days
- A weekly summary you actually read
Not worth paying for
- Numbers X already shows you for free
- Team features when you work alone
- Ten networks when you only post on X
- Charts with no advice on what to change
Free ways to check your numbers first
Try the free route for a week before you pay. You will learn which numbers you actually look at.
- 1
Switch to a free Professional Account
It adds Professional Home with 28 days of account analytics. - 2
Work out your engagement rate
Copy the numbers under a post into the Twitter engagement rate calculator. It compares your result with 1,184 real posts. - 3
Track your follower count
Save a daily count with the Twitter follower tracker. No login. - 4
Write down your three best posts each week
Note the format and topic of each. If you keep doing this by hand, a paid tool will save you time.
Analytics is one job among several. For the rest (scheduling, replies, writing), see the best X growth tools, compared by job.
Frequently asked questions
What is the best Twitter analytics tool?
It depends on the job. For a solo account that wants to know what to post next, ClimbX ($29/month) ranks your formats and topics and gives a weekly report. For cheap basic X stats inside a scheduler, Typefully ($99 a year). For follower and unfollower tracking, Circleboom. For a team reporting on many networks, Sprout Social or Metricool.
Is X (Twitter) analytics free?
Partly. Anyone can see view counts on posts. A free Professional Account adds Professional Home with 28 days of account analytics. X’s business help says the Post Activity dashboard is free with an ads account. The newer analytics page in the X app is a paid feature. Today it starts with the $8 Plus plan.
Do I need X Premium to see my Twitter analytics?
For the main analytics page in the X app, you need a paid plan. Today the cheapest is Plus at $8 a month. You can still see view counts on every post without Premium, and Professional Home shows 28 days of account analytics on a free Professional Account. Third-party tools read your stats through the X API, so they do not need Premium either.
Does Hypefury still have Twitter analytics?
No. Hypefury’s own pricing page FAQ says it no longer supports X. It now covers Bluesky, Threads, LinkedIn, Instagram and TikTok.
Can I export my Twitter analytics?
Yes. X’s Post Activity dashboard exports a CSV of up to 30 days at a time, with a cap of 3,000 posts per file. Typefully lets you download chart data as CSV on its Business plan. Metricool and Sprout Social build PDF or shareable reports.
How do I track who unfollowed me on Twitter?
X does not show this. Circleboom has Who Unfollowed Me on its paid plans, for accounts with up to 25,000 followers. To track your follower count over time for free, use the ClimbX Twitter follower tracker.
Bottom line
X’s free numbers are enough to start. Pay for a Twitter analytics tool only when it does something X doesn’t. Typefully is the cheapest. Circleboom tracks followers. Metricool and Sprout Social are for teams. ClimbX tells a solo account what to post next.
See which of your posts actually work.
ClimbX ranks your formats and topics, finds your best time to post and sends a weekly report. Then it drafts posts in your voice for you to edit. From $29/month, 7-day trial.
Read next
- The Best X Growth Tools in 2026, Compared by Job - Compare eight X growth tools by the job they actually solve: research, writing, scheduling, engagement, analytics, automation and multi-network publishing.
- Typefully Alternatives for X: 6 Tools Compared by What They Do - Six Typefully alternatives for X, sorted by job: writing, scheduling, growth and replies. Checked prices, who each suits, and when to stay on Typefully.
Sources
- X Business: Post and Video Activity Dashboards - free with an ads account, 28-day default, 30-day and 3,000-post CSV limits, checked October 25, 2026
- X Help: Professional Accounts - Professional Home with 28 days of account analytics, free to switch
- X Help: View counts - anyone can see view counts on posts
- @Subscriptions on X (June 13, 2024) - new analytics page, upgrade to Premium for daily insights
- SpaceXSI: The X Subscription pricing - Plus $8 a month with Advanced Analytics, checked October 25, 2026
- Typefully pricing - Creator $99 a year, Business $20 a month per social set, checked October 25, 2026
- Tweet Hunter pricing - Discover $29, Grow $49, Enterprise $200 a month, checked October 25, 2026
- Circleboom Twitter pricing - Pro $31.99 a month, unfollower tracking up to 25,000 followers, checked October 25, 2026
- Metricool pricing - Starter from $25, X add-on $10 per account, 30-day X metric storage, checked October 25, 2026
- Sprout Social pricing - Essentials $99 a seat monthly or $79 yearly, checked October 25, 2026
- Hypefury features and pricing - FAQ: Hypefury no longer supports X